The Definition of Supply
Supply is the Willingness and Ability for a producer to produce and sell a good at a specific Price, Quantity and Time
Law of Supply
The definition of Supply
Supply is the Willingness and Ability for a producer to produce and sell a good at a specific Price, Quantity and Time.
The Supply Curve
Credits to: savemyexams
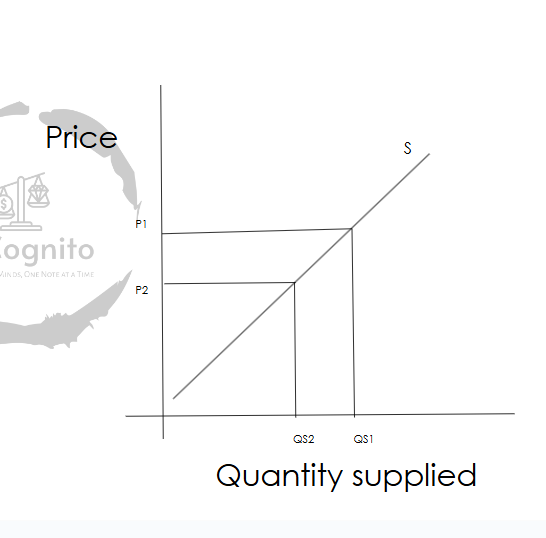
A supply curve is a graphical representation of the relationship between the price of a good or service and the quantity supplied for a given period of time.
Its typically Upward sloping
The supply curve diagram will always have ‘Price’ on the Y axis and ‘Quantity supplied’( henceforth referred to as ‘QS’) on X axis.
Points where the values of ‘Price’ and ‘QS’ meet are plotted to make the demand curve, which is labelled as ‘S’ or ‘S1’
When we draw it, we tend to make it as a straight line as this is much simpler and easy to understand. [Practically the curve will indeed be a curve.]
However, for exams you will be ok with drawing a straight line for the ‘curve’
{In the graph we can see that due to a price decrease from P1 to P2 there has been a QS decrease of QS1 to QS2}
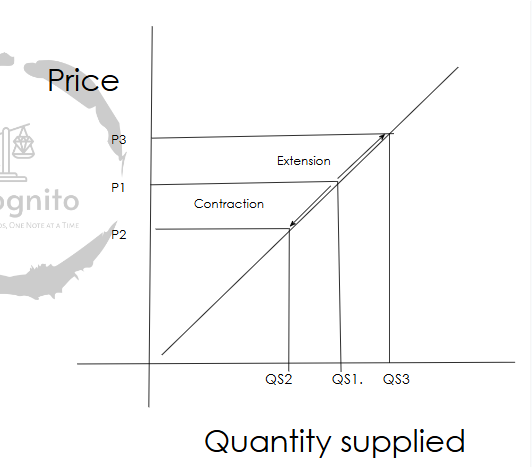
Movement along the demand curve
Credits to: savemyexams
There are 2 types of movements along the curve, extension and contraction just like demand, these only occur when price changes are the cause of the supply change.
Extension: Supply increases due to increase in price.(QS1 TO QS3)
Contraction: Supply decreases due to decrease in price(QS1 TO QS2)
Same principles as for demand
Individual and market supply
Same as for demand, individual supply is the supply by a individual firm at a given price.
Market supply is the total of all individual supplies in the market
Individual supplies(10,3,7 at price $10)
So market supply at price $10 is 20( 10+3+7 )
Assumptions
The law of diminishing marginal returns
This states that if there is a increasing variable input ( say labour ) to fixed factors ( say land ) there will be initially a increase in productivity, but after a point the benefits of hiring more of the variable input will reduce, or the marginal return from the input reduces.
Hence productivity reduces, this is often due to overcrowding. Too many workers to produce efficiently. Example
No. of workers. Total output. Marginal return
One 10 10
Two 23. 13
Three 37 14
Four 45 8
At four workers we can see overcrowding has occurred as marginal returns have started to decrease.
With this you can also understand what marginal returns are; benefits that a single unit of labour in this case brings to a firm
The law of increasing marginal costs
This states that if the producer wants to increase quantity supplied of their good, the additional cost of producing each good will also increase.
Hence we see in supply curves that supply only extends when the prices increase as the higher prices are needed to cover up the firms extra costs. Only then will they supply more of the good.
Non price determinants of supply
The non price determinants just like in demand cause a shift in the supply curve. Refer to unit 2.1 notes to see how to draw shifts in supply curve.
Costs of production: This refers to the cost of resources, if COP increases the profit margins for the current supply curve would reduce hence the firm would reduce supply at current price. Shift to left. If costs reduce there will be a shift to the right.
Indirect taxes: indirect taxes affect cost of production, if taxes increase, costs increase; shift to left, if taxes decrease, cost decrease; shift to the right.
Subsidies: Subsidies are grants given by the government to the firms to reduce their cost of production. If subsidies reduce the costs increase, shift to the left. If subsidies increase, costs reduce, shift to the right.
New technology: New technologies increase productivity and lower cost of production, hence shift to the right. If firms are using ageing technology the productivity reduces and costs increase. Shift to the right.
Number of suppliers: If there are more suppliers entering the market, the supply will increase, there will be a shift to the right. If there are suppliers exiting the market, the supply will decrease, there will be a shift to the left.
Weather: Droughts for example will reduce supply for agriculture markets for obvious reasons, shift to the left. If there are good weather conditions the supply for agriculture markets will increase, shift to the right.
Future Price expectations: if firms expect prices for their products to rise they may withhold some supply from the market for the future. Curve shift left. If firms expect prices to fall, they will increase supply for current price to make as much profit. Shift to right
Goods in joint supply: such goods are those that are made from the same raw materials, ex, lamb and sheepskin. If the price for lamb meat increases, the supply for it will increase. Along with it the supply for sheepskin will also increase. As suppliers might as well use the leftover materials to produce more goods. Supply shifts to the right. Vice versa
Producer substitutes: This refers to when suppliers produce goods that require the same resources, like farmers can only produce one crop at a time. A farmer can only grow wheat or potatoes at a time, if the prices of potatoes increase the supply for them will extend, meaning more resources are being used for potatoes (land, labour) than for wheat. Hence wheat supply reduces, shift to left. Vice -versa