Aggregate Demand (AD)
- Definition: Total demand for goods/services in an economy at a given price level in a specific period.
Formula: AD = C + I + G + (X – M) - C: Consumer spending
- I: Investment (business spending)
- G: Government spending
- (X – M): Net exports (Exports minus Imports)
Factors influencing AD:
- Consumer confidence: Higher confidence boosts spending (Example: Post-COVID recovery in the U.S. in 2021).
- Interest rates: Lower interest rates encourage borrowing and spending (Example: ECB’s low rates in 2015).
- Government policy: Fiscal stimulus, tax cuts, or increased spending (Example: Biden’s 2021 stimulus package).
AD curve – Downward sloping due to the inverse relationship between price level and output.
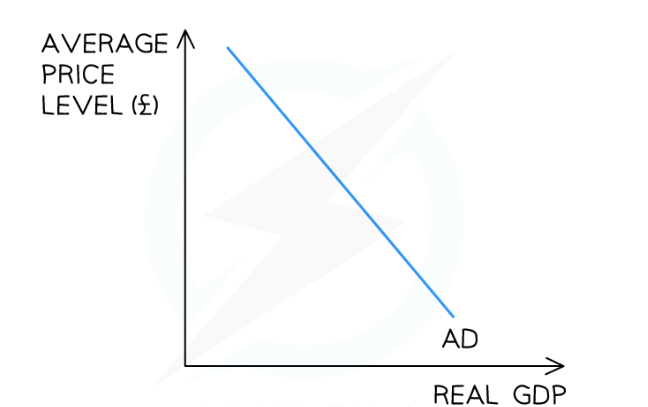
Credits to: SaveMyExams
Movement Along AD Curve:
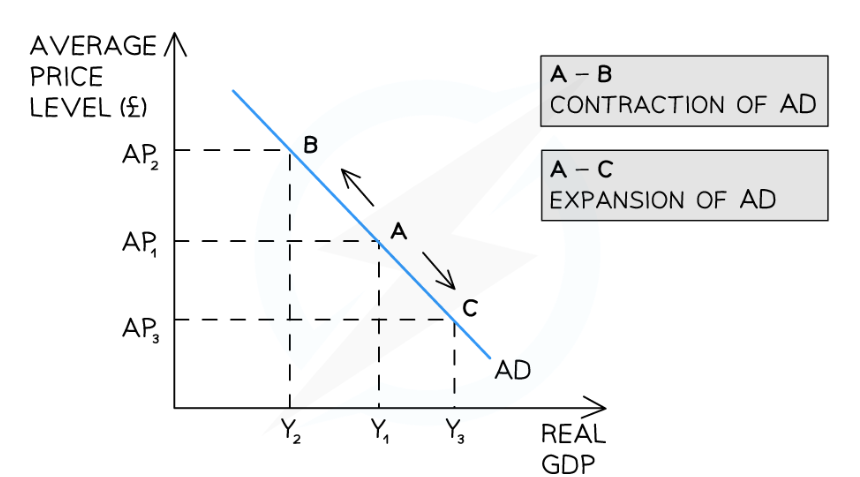
Credits to: SaveMyExams
- When: Caused solely by changes in the price level.
- Example: A general decrease in price levels increases the quantity of goods demanded (movement down the AD curve).
Credits to: SaveMyExams
Shift Of AD Curve
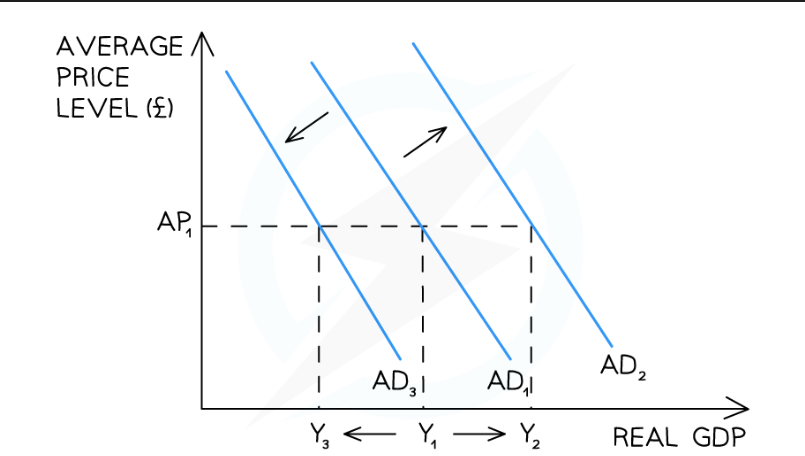
Credits to: SaveMyExams
- Rightward shift (increase in AD): Due to factors like increased consumer confidence, government stimulus, or a rise in exports.
- Example: The U.S. fiscal stimulus after COVID-19 increased AD.
- Leftward shift (decrease in AD): Driven by higher interest rates, reduced government spending, or decreased exports.
- Example: The Bank of England’s interest rate hikes in 2022 slowed consumer spending, shifting AD left.
Credits to: SaveMyExams
Short-run Aggregate Supply (SRAS)
- Definition: Total output of an economy at different price levels when some inputs (like wages) are fixed in the short run.
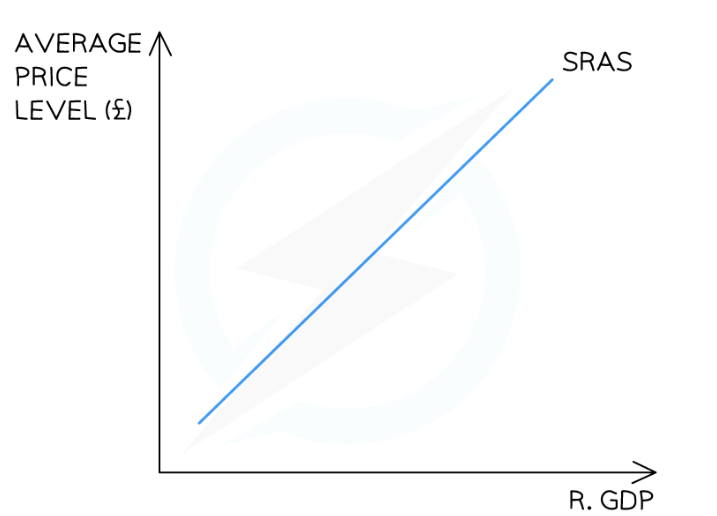
Credits to: SaveMyExams
Factors influencing SRAS:
- Changes in resource prices: Lower prices for key inputs like oil reduce costs and shift SRAS right.
- Example: A decrease in oil prices reduces costs for producers, increasing output.
- Supply shocks: Natural disasters or geopolitical issues can reduce output and shift SRAS left.
- Example: The 2022 Russian invasion of Ukraine disrupted grain supplies, reducing SRAS.
- Government regulations and taxes: Increased regulation or taxes can raise production costs, shifting SRAS left.
- Example: The EU’s emission regulations impacted industrial output.
- Productivity changes: Higher productivity or better technology shifts SRAS right.
- Example: The advent of automation has improved manufacturing productivity.
Movement along the SRAS curve:
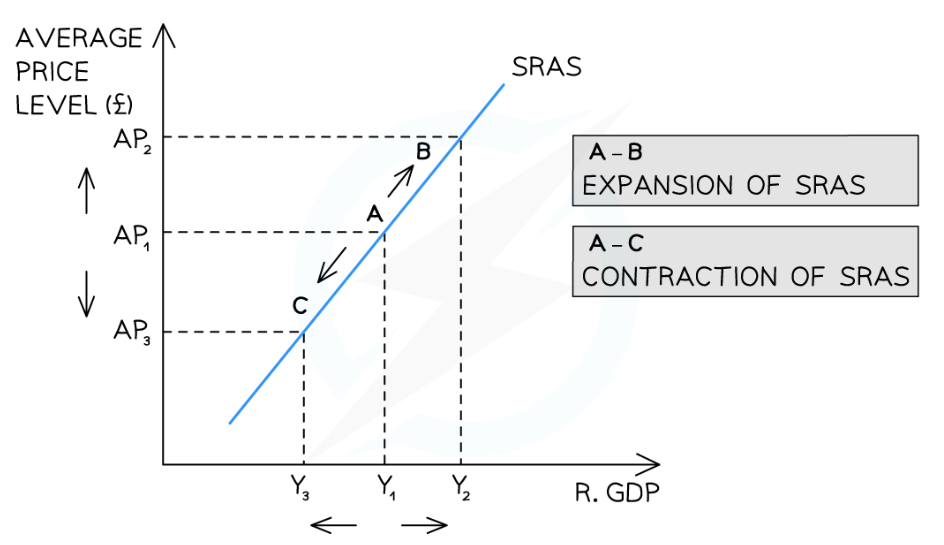
Credits to: SaveMyExams
- When: Caused by changes in price levels.
- Example: As the price level rises, firms increase production to capitalize on higher prices (movement up the SRAS curve).
Credits to: SaveMyExams
Shift of the SRAS curve:
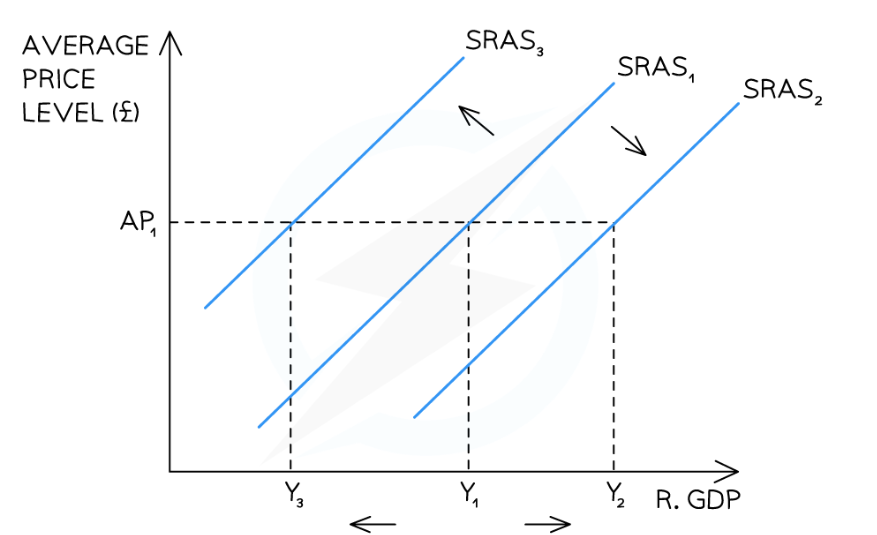
Credits to: SaveMyExams
Rightward shift (increase in SRAS): Triggered by falling input costs, technological advancements, or improved productivity.
- Example: Lower oil prices or technological innovations in manufacturing.
Leftward shift (decrease in SRAS): Caused by supply shocks, increased costs, or higher taxes.
- Example: Disruptions in the global supply chain during the COVID-19 pandemic.
Credits to: SaveMyExams
Alternative Views of Aggregate Supply (AS)
1) Keynesian View: Horizontal at low output levels (recession) and vertical at full employment (inflationary gap).
- Movement along the Keynesian AS curve: When the economy is below full employment, increases in AD do not increase the price level (horizontal part). When full capacity is reached, increases in AD only cause inflation (vertical part).
- Example: Japan’s “lost decade” (1990s) saw stagnant growth despite increased AD.
2) Classical View: The AS curve is vertical at full employment, indicating that changes in AD only affect price levels, not output.
- Example: U.S. during periods of full employment sees price level changes, but output remains the same.
Comparison of Diagrams:
Keynesian:
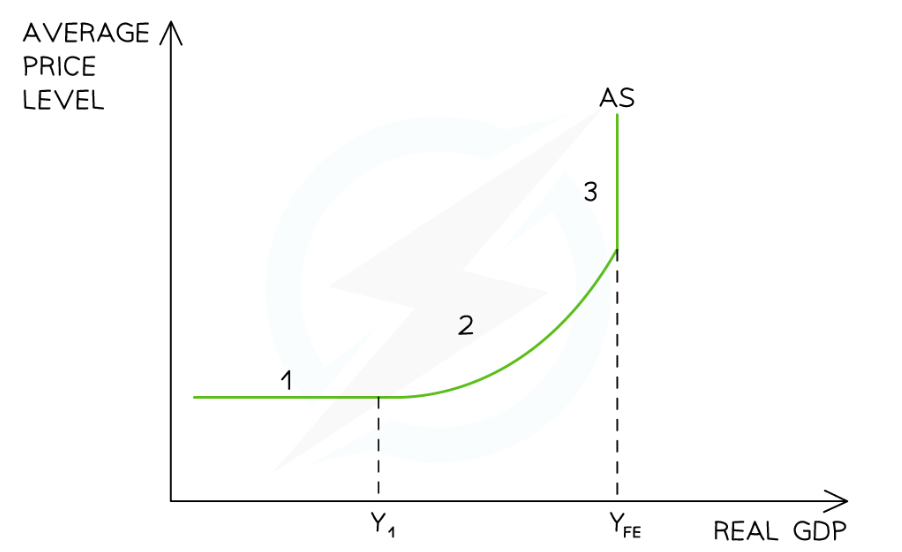
Credits to: SaveMyExams
Classical:
Credits to: SaveMyExams
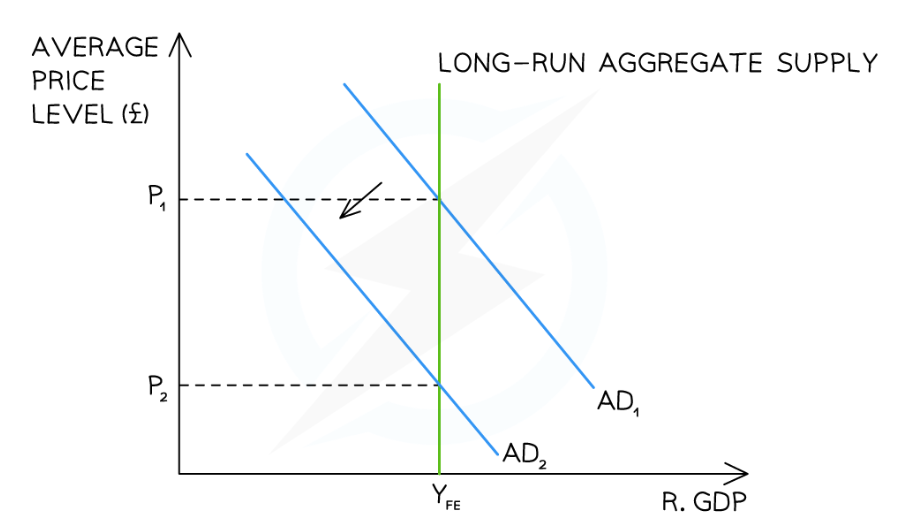
LRAS (Long Run Aggregate Supply):
- Definition: The economy’s maximum potential output, determined by factors like labor, capital, and technology, is vertical at full employment.
Factors Influencing LRAS:
- Technological advancements: Boost efficiency and output.
- Example: Advances in AI and automation in industries.
- Improvement in labor quality and quantity: Through education, training, or increased labor force.
- Example: Germany’s vocational training system has led to a highly skilled workforce.
- Capital investment: More infrastructure or industrial capacity increases potential output.
- Example: China’s infrastructure boom under the Belt and Road Initiative.
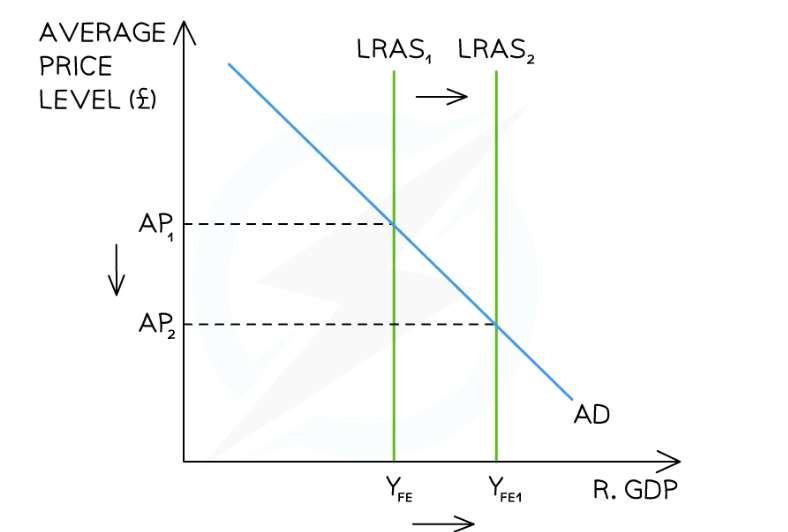
Shift of the LRAS curve:
- Rightward shift (increase in LRAS): Due to improvements in technology, labor quality, or capital.
- Example: Technological innovations and investment in education shifting LRAS in developed economies.
- Leftward shift (decrease in LRAS): Reduced productive capacity from wars or natural disasters.
- Example: The destruction of Syrian infrastructure during the civil war reduced its LRAS.
Credits to: SaveMyExams
Macroeconomic Equilibrium
- Definition: The point where AD equals AS, determining the economy’s overall output and price level.
Types of Equilibrium:
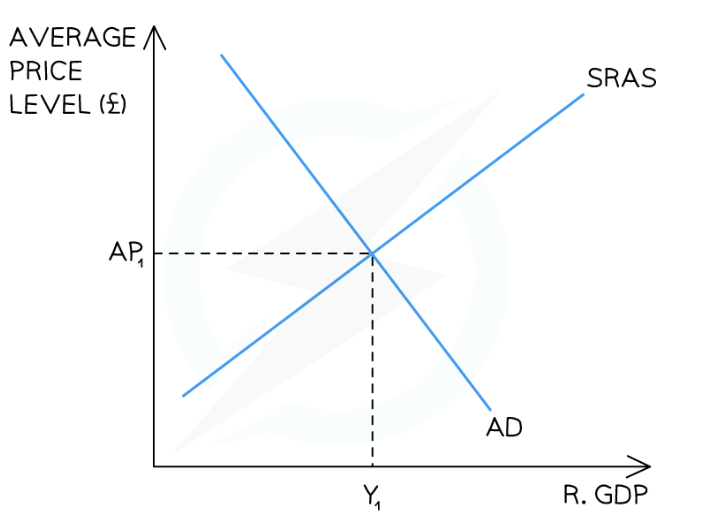
Short Run:
- Short-run equilibrium:
The intersection of the AD and SRAS curves.
Example: During the post-pandemic recovery, mismatches between demand and supply led to inflation.
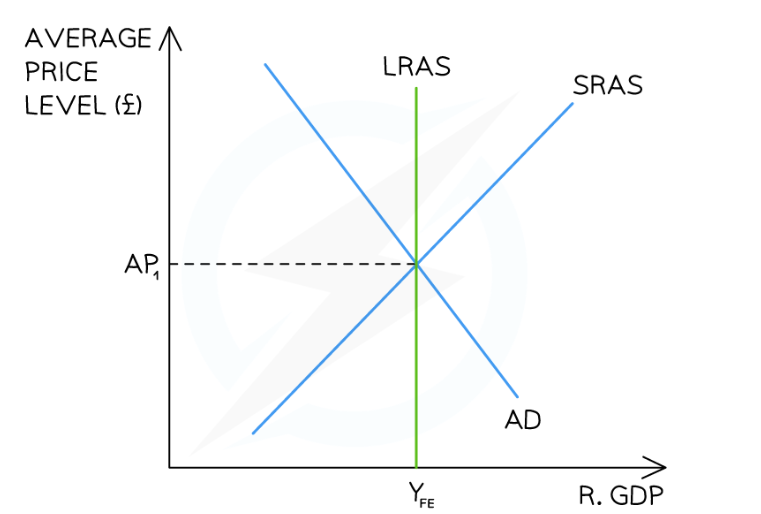
Long Run:
- The intersection of AD and LRAS, where the economy is at full employment and output equals potential output.
- Example: The U.S. economy in 2019, where AD met LRAS, reflecting stable growth and low unemployment.
Diagrams of Equilibrium:
Short-Run
Credits to: SaveMyExams
Long-Run
Credits to: SaveMyExams