Circular Flow of Income Model
Households and Firms Interactions:
Households provide factors of production (labor, land, capital) to firms in exchange for income (wages, rent, etc.).
Example: A factory (firm) hires workers (households) and pays them wages, which they then spend on goods and services.
Firms Produce Goods and Services for Households:
Firms use the factors of production to create goods/services for sale to households.
Example: A local bakery sells bread to consumers.
Government Role:
Collects Taxes: Governments collect taxes from both households (income tax) and firms (corporate tax).
Provides Public Goods and Services: Governments provide public goods (infrastructure, education, healthcare) funded by taxes.
Example: Schools and hospitals are funded by tax revenue.
Circular Flow of Income Model: Expanded
Injections: Additions to the economy, which include:
- Investment (I): Spending on capital goods (e.g., machinery).
- Government Spending (G): Expenditure on public services (e.g., infrastructure projects).
- Exports (X): Sale of goods/services to other countries.
Leakages: Withdrawals from the economy, which include:
- Savings (S): Income not spent on consumption.
- Taxes (T): Income paid to the government.
- Imports (M): Purchase of goods/services from other countries.
Circular Flow of Income (Expanded) Diagram:
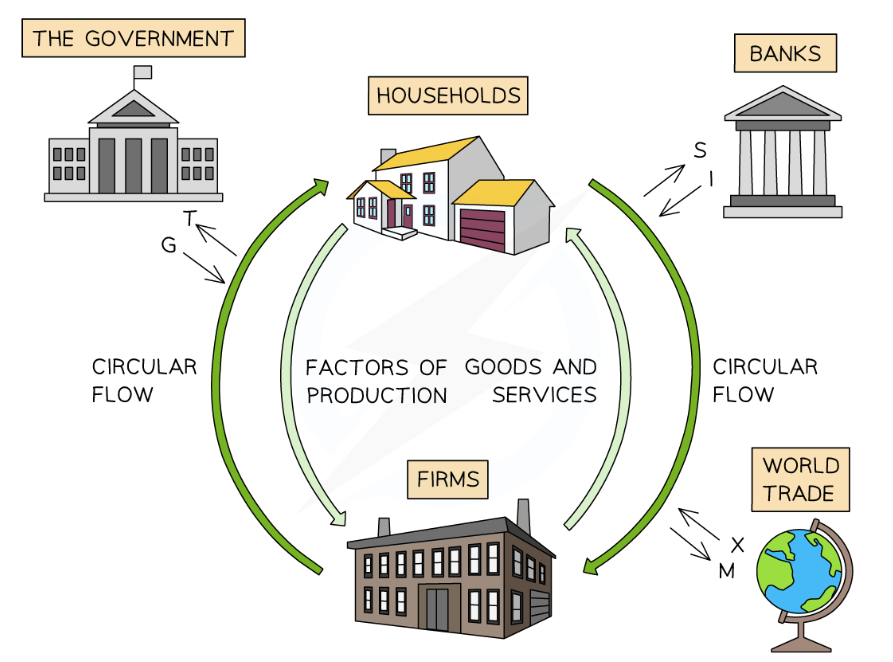
Credits to: SaveMyExams
National Income Accounting
Methods of Measurement:
- Output Method: Measures total value of goods and services produced in an economy. Example: A country’s total output of cars, textiles, and software is calculated to find GDP.
- Income Method: Measures total income earned by factors of production (wages, rents, interests, and profits).Example: Salaries paid to workers, dividends to shareholders contribute to national income.
- Expenditure Method: Total spending on goods and services, calculated using the formula: GDP = C + I + G + (X – M) where:
- C: Consumption by households
- I: Investment by businesses
- G: Government spending
- (X – M): Net exports (exports minus imports)
Main Concepts:
- GDP (Gross Domestic Product): Measures the economic performance of a country.
- Example: The United States had a GDP of approximately $21 trillion in 2021.
- GNI (Gross National Income): GDP plus net income from abroad (e.g., remittances).
- Example: If a country’s GDP is $500 billion and it receives $50 billion from citizens working abroad, GNI would be $550 billion.
- Nominal vs. Real GDP: Nominal is measured at current prices; real is adjusted for inflation.
- Example: If nominal GDP is $1 trillion and inflation is 2%, real GDP is approximately $980 billion.
- GDP per capita: GDP divided by population, indicating average economic output per person.
- Example: A country with a GDP of $1 trillion and a population of 100 million has a GDP per capita of $10,000.
Green GDP
Concept:
- Green GDP adjusts GDP for environmental costs of production, such as pollution and depletion of natural resources.
- Example: If a country has a nominal GDP of $2 trillion but incurs $300 billion in environmental costs, its Green GDP would be $1.7 trillion.
Importance:
- Highlights the sustainability and environmental impact of economic activities.
- Encourages policies that account for ecological damage and promote sustainable development.
- Example: Countries like China are increasingly adopting Green GDP measures to balance economic growth with environmental protection.
The Business Cycle Diagram:
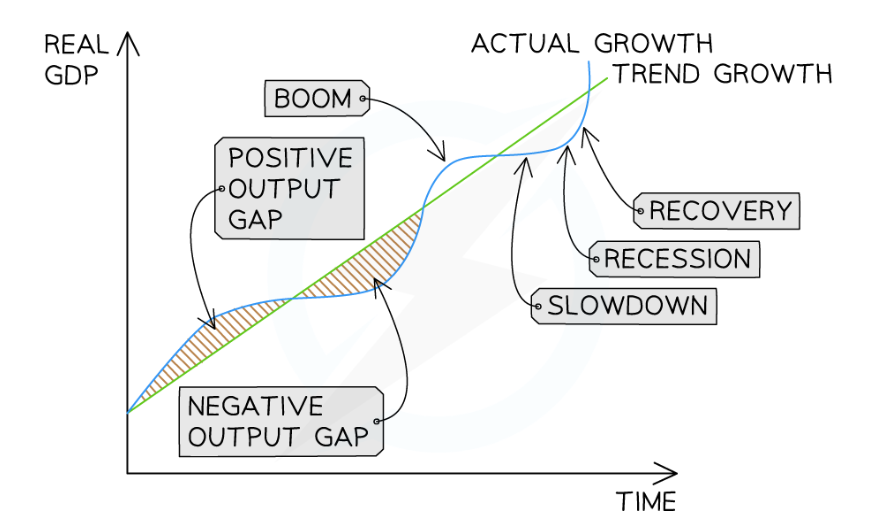
Credits to: SaveMyExams
Key Concepts:
- Expansion: Economic activity rises; unemployment decreases; consumer spending increases.
- Example: Post-2008 financial crisis recovery, where GDP growth resumed.
- Peak: The economy reaches its maximum output before decline; inflation may rise.
- Example: The U.S. experienced a peak in the economy in early 2020 before the COVID-19 pandemic.
- Contraction: Economic activity slows; GDP declines; unemployment rises.
- Example: The 2020 recession caused by the COVID-19 pandemic led to significant economic contraction globally.
- Trough: Lowest point of economic activity before recovery.
- Example: The 2008 financial crisis had a trough in economic activity in 2009 before recovery began.
- Long-term Growth:
- Shows the overall trend of increasing GDP over time, despite short-term fluctuations.
- Example: The U.S. economy has shown long-term growth despite experiencing multiple recessions.
The Use of National Income Data
- Uses:
- Government: National income data informs policy-making, budget allocations, and economic planning. Example: A government may use GDP data to decide on infrastructure investments.
- Businesses: Companies analyze national income data for market trends, investment opportunities, and consumer behavior. Example: A tech company might invest more in a country with rising GDP growth and increasing disposable income.
- Economists: Researchers use national income data to study economic performance and forecast future trends. Example: Economists analyze GDP growth rates to predict economic conditions for the upcoming year.
Limitations of National Income Data:
- Comparisons: Differences in data collection methods, exchange rates can distort comparisons. Example: GDP figures may not be directly comparable between countries with different measurement techniques.
- Non-market Activities: GDP excludes unpaid work and informal sector contributions. Example: Volunteer Work and household chores, which contribute to societal well-being, are not included in the GDP.
- Quality of Life: GDP does not account for happiness, health, or environmental quality. Example: Countries with high GDP may still struggle with issues like pollution and inequality.
Other Measures of Economic Activity
- Human Development Index (HDI): A composite measure that evaluates health (life expectancy), education (mean years of schooling), and standard of living (GNI per capita).
- Example: Norway consistently ranks high on the HDI due to its strong healthcare and education systems.
- Genuine Progress Indicator (GPI): Measures economic progress by factoring in environmental and social costs.
- Example: GPI adjusts GDP by considering costs of crime, pollution, and family work.
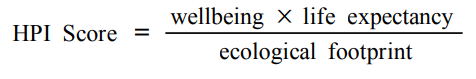
- Happy Planet Index (HPI): Measures well-being and environmental impact, reflecting the efficiency with which countries deliver long, happy lives.
- Example: Countries like Costa Rica often score high on the HPI due to their focus on happiness and sustainability.
- Formula:
Income Distribution
Measurement:
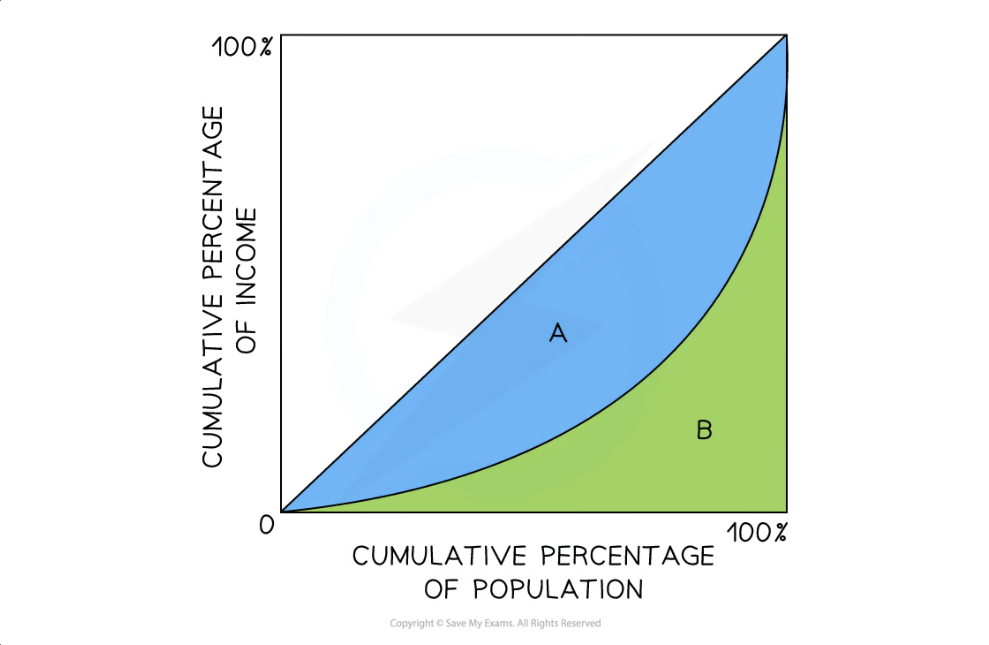
- Lorenz Curve: Graph representing income distribution; the further the curve from the diagonal line of equality, the greater the inequality.
- Example: A Lorenz Curve for a country with significant wealth disparity would be more bowed outward.
- Gini Coefficient: A numerical measure of income inequality ranging from 0 (perfect equality) to 1 (perfect inequality).
- Example: A Gini coefficient of 0.25 indicates relatively equal income distribution, while a coefficient of 0.55 suggests high inequality (e.g., South Africa).
Lorenz Curve and Gini Coefficient diagram:
Lorenz Curve
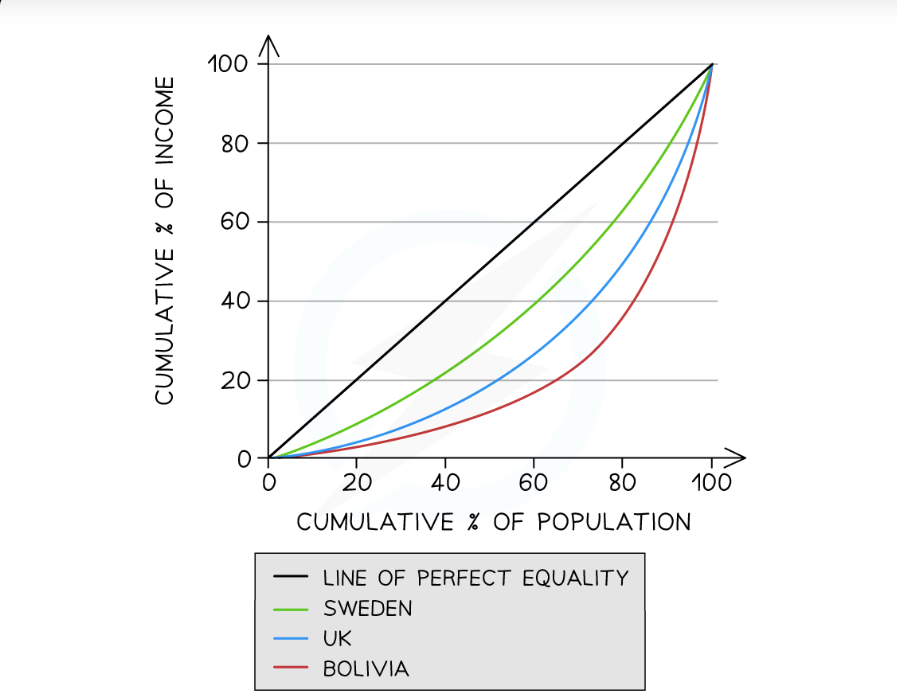
Credits to: SaveMyExams
Gini Coefficient
Credits to: SaveMyExams
Evaluating Economic Measures:
GDP:
- Strength: A widely used indicator of economic performance.
- Weakness: Does not reflect income distribution or well-being.
- Example: Countries like the U.S. may have high GDP but significant wealth gaps.
Green GDP
- Strength: Incorporates environmental costs.
- Weakness: Difficult to measure and calculate accurately.
- Example: China’s efforts to implement Green GDP face challenges in data collection.
HDI:
- Strength: Provides a broader measure of development than GDP alone.
- Weakness: Still limited in scope as it doesn’t capture all aspects of well-being.
- Example: A country may have a high HDI but low social equity.
Importance:
- Understanding these measures helps in making informed economic policies.
- Recognizes the need for multiple indicators to get a complete picture of economic well-being.
Example: Policymakers may prioritize economic growth while also considering social and environmental factors.